R Pie Charts
🥧 R Pie Charts
Each slice represents a proportion or percentage of the total.
1. Basic Pie Chart
Use the pie() function.
2. Pie Chart with Title
3. Pie Chart with Colors
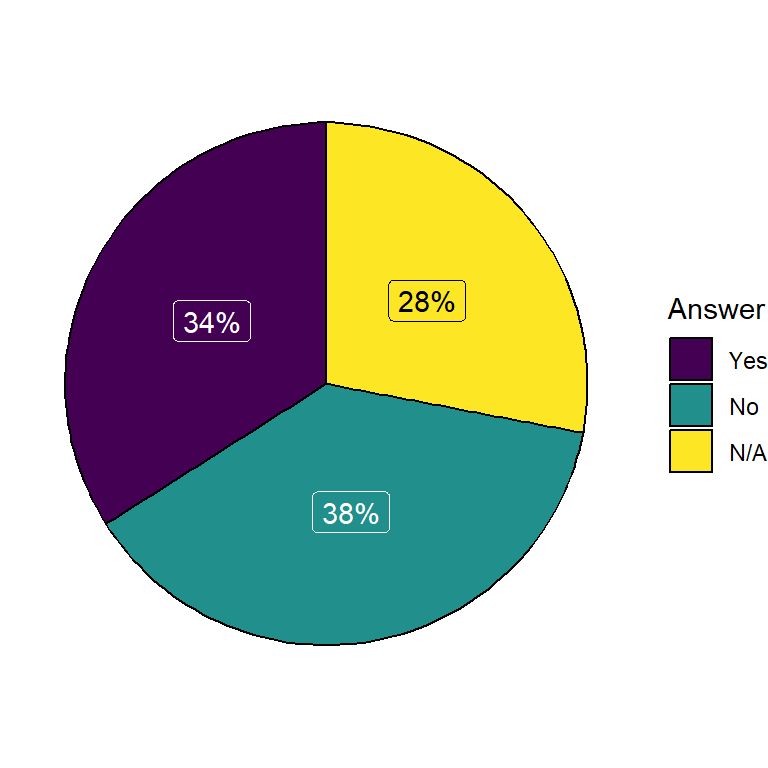
4. Pie Chart with Percentages
5. Exploded Pie Chart
📌 R does not support explode directly, but radius and angle help visually.
6. Pie Chart from Data Frame
7. 3D Pie Chart (Extra Package)
When NOT to Use Pie Charts ⚠️
❌ Too many categories
❌ Comparing small differences
✔ Use bar charts instead in such cases
📌 Summary
-
Pie charts show proportions
-
Created using
pie() -
Can add colors & percentages
-
Best for simple datasets


