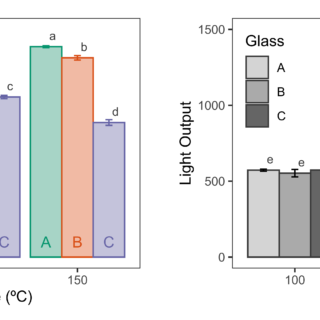
R Bar Charts
📊 R Bar Charts In R Bar Charts are used to compare values across categories. They are one of the most common and easy-to-understand visualizations. 1. Basic Bar Chart Use the barplot() function.
1 2 3 4 | values <- c(80, 70, 90) names(values) <- c("Math", "English", "Science") barplot(values) |
...