MongoDB Charts

MongoDB Charts
It is a built-in feature of MongoDB Atlas and is widely used for analytics, reporting, and business insights.
What is MongoDB Charts?
Visualizes MongoDB data in real time
No SQL or coding required
Connects directly to Atlas clusters
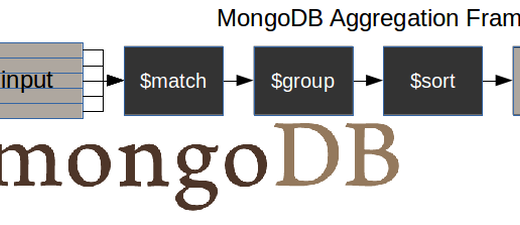
Supports aggregation pipelines
Create dashboards & share them
Why Use MongoDB Charts?
Real-time analytics
No ETL or data export
Secure & role-based access
Uses MongoDB Aggregation internally
Responsive & interactive dashboards
Supported Chart Types
Bar Chart
Line Chart
Area Chart
Pie / Donut Chart
Table
Heatmap
Geo Map
KPI / Number Chart
How MongoDB Charts Works (Flow)
Step-by-Step: Create a Chart
1️⃣ Open MongoDB Atlas
Go to Charts section
Click New Dashboard
2️⃣ Connect Data Source
Select Cluster
Choose Database & Collection
3️⃣ Choose Chart Type
Example: Bar Chart
X-Axis →
courseY-Axis →
countAggregation →
COUNT
4️⃣ Apply Filters (Optional)
Example:
age > 20course = BA
5️⃣ Save & Add to Dashboard
Resize & arrange charts
Add multiple charts per dashboard
Example Use Case
Student Analytics Dashboard
Students per course (Bar Chart)
Average age trend (Line Chart)
Course distribution (Pie Chart)
Total students (KPI)
MongoDB Charts vs BI Tools
| MongoDB Charts | Power BI / Tableau |
|---|---|
| Native MongoDB | External tool |
| No data export | Requires ETL |
| Real-time | Scheduled refresh |
| Easy setup | Complex setup |
Security & Sharing
Share dashboards via link
Control access using Atlas roles
Embed charts in web apps (iframe)
MongoDB Charts vs Aggregation
Aggregation → data processing
Charts → data visualization
Charts internally use aggregation pipelines
Best Practices
Index fields used in charts
Pre-aggregate heavy reports
Use filters for performance
Avoid very large collections without
$match
Common Mistakes
No indexes → slow charts
Too many widgets in one dashboard
Not filtering data
Expecting charts to modify data