R Bar Charts
📊 R Bar Charts
They are one of the most common and easy-to-understand visualizations.
1. Basic Bar Chart
Use the barplot() function.
2. Bar Chart with Title & Axis Labels
3. Bar Chart with Colors
4. Horizontal Bar Chart
5. Bar Chart with Border
6. Bar Chart with Exact Values on Bars
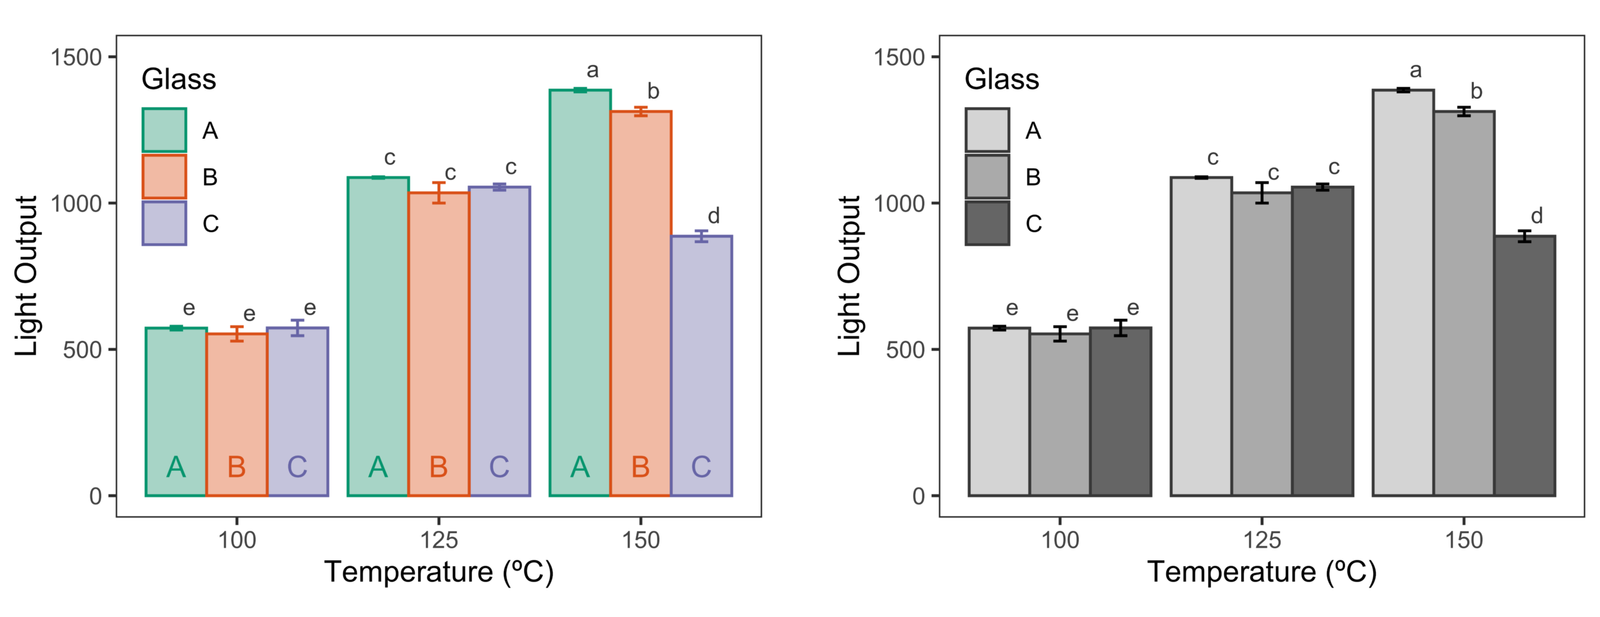
7. Grouped Bar Chart
8. Stacked Bar Chart
9. Bar Chart from Data Frame
When to Use Bar Charts?
✔ Compare categories
✔ Show discrete data
✔ Easy visual comparison
📌 Summary
Bar charts compare categorical values
Created using
barplot()Supports vertical, horizontal, grouped & stacked
Highly customizable


