R Plotting
Plotting in R means creating graphs and charts to visualize data.
R has very strong built-in plotting capabilities, widely used in statistics, data analysis, and research.
1. Basic Plot in R (plot())
The plot() function is the most commonly used plotting function.
✔ Creates a scatter plot by default
2. Line Plot
📌 type = "l" → line
Other types:
"p"→ points (default)"b"→ both line & points
3. Scatter Plot with Customization
4. Bar Plot (barplot())
✔ Best for categorical data
5. Histogram (hist())
✔ Shows frequency distribution
6. Pie Chart (pie())
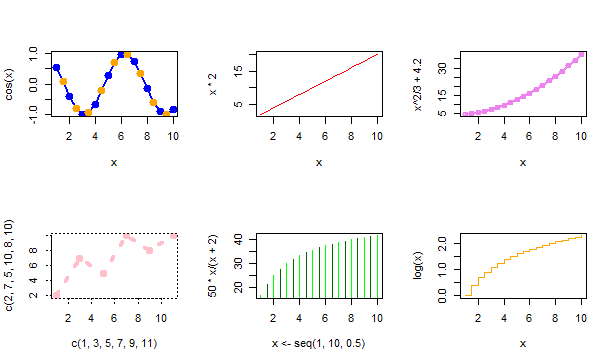
7. Multiple Plots in One Window
8. Adding to Existing Plot
9. Save Plot to File
✔ Saves plot as an image
10. Plotting Data Frames
Base R Plotting Functions
| Function | Use |
|---|---|
plot() | General plotting |
barplot() | Bar chart |
hist() | Histogram |
pie() | Pie chart |
boxplot() | Box plot |
📌 Summary
R has powerful built-in plotting tools
plot()is the base functionSupports line, scatter, bar, hist, pie
Highly customizable


